iPage: Using visitor statistics to monitor your site
Raw log files record every request made to your website. Each time a visitor accesses a page, information about that request is stored in the log file. Web analytics tools, such as Visitor Statistics, use this data to generate reports that help you understand where visitors come from, how frequently they return, and how they interact with and navigate your website.
In this article, we will discuss:
- How to access your log files
- What analytics tool do I have?
- Understanding your Visitor Statistics tools
- What Visitor Statistics track
- How to access your graphs and reports
- How to change the Webalizer settings
- How to manage Visitor Statistics email reports
- I have updated my Website statistics, but they still appear to be old.
- Review
How to access your log files
If you prefer to analyze your website traffic using your own reporting tools, you can access and download your raw log files using any of the following methods:
Access log files via FTP
- Log in to your FTP account using an FTP client.
- Navigate to the /stats directory.
- Download the desired log files to your computer.
Access log files via File Manager
- Log in to your hosting control panel.
- Open the File Manager tool.
- Navigate to the /stats directory.
- Download the log files you wish to view.
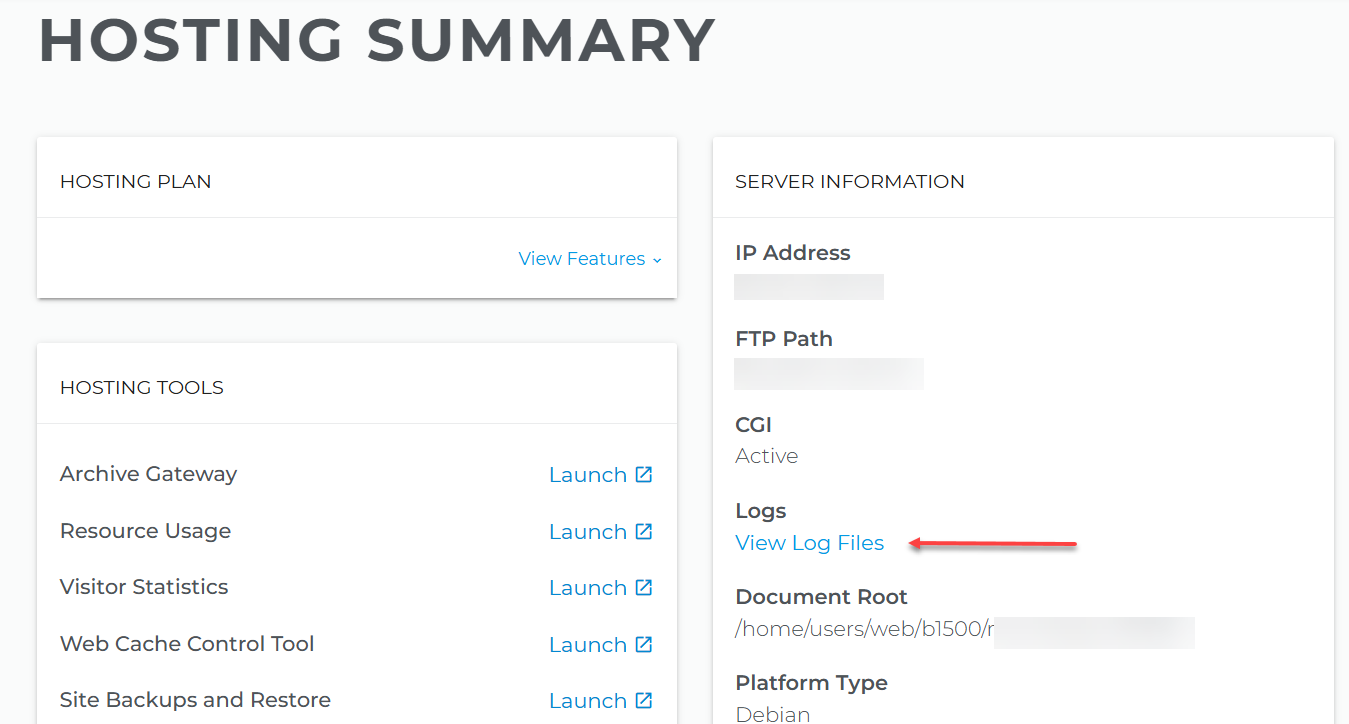
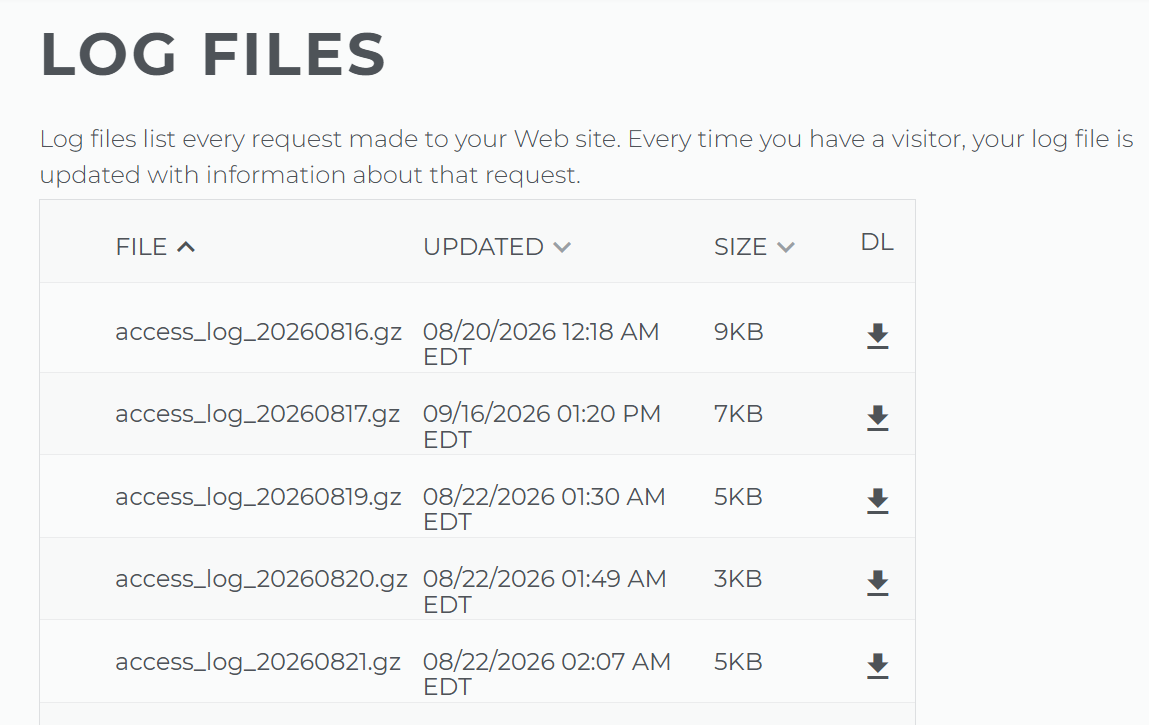
Access log files via Log Files page
- Log in to your hosting control panel.
- In the Hosting Summary page, click View Log Files.
- Download the log files you wish to view.
What analytics tool do I have?
Our Visitor Statistics use AWStats and Webalizer to help you track website traffic and visitor activity through detailed graphs and reports. The two tools read your log files differently. Depending on your hosting plan, you may have access to either one of these analytics tools or both.
- UNIX hosting accounts include both AWStats and Webalizer under Visitor Statistics, allowing you to view and analyze website traffic and visitor activity.
- Windows hosting accounts use Webalizer to provide insights into website traffic, visitor behavior, and overall site performance.
Understanding your Visitor Statistics tools
Both AWStats and Webalizer use information collected in raw server log files rather than JavaScript-based tracking methods. This allows them to report on all requests recorded by the web server, including visits from search engine crawlers and other automated tools. Both tools are free to use.
AWStats
AWStats is a powerful and feature-rich analytics tool that generates detailed graphical reports from web server logs. It can analyze website traffic, visitor activity, bandwidth usage, operating systems, browsers, search engines, referring sites, and more. In addition to web statistics, AWStats can also be configured to generate reports for streaming, FTP, and mail server activity, making it a comprehensive solution for monitoring various types of server usage.
Webalizer
Webalizer is a web server log analysis tool that converts web server access logs into easy-to-read reports about website traffic and usage. It generates web-based reports that summarize important metrics such as page views, visits, unique visitors, referrers, entry pages, exit pages, and daily or monthly traffic trends. Its straightforward reporting format makes it a useful tool for quickly reviewing website performance and visitor behavior.
What Visitor Statistics track

Visitor Statistics tool tracks the following information about visitor activity (usage) on your site:
- Files
- Hits
- Kbytes
- Pages
- Referrers
- Search strings
- Sites
- URLs
- User Agents
- Usernames
- Visits
- Response codes
Files
The number of files that have been requested (downloaded) from your site during the reporting period.
Websites contain a collection of computer files sent by a remote computer (the web server) to the client (web browser) as the client requests them. Files (the outgoing response to a request) include all viable web file formats, such as HTML files (.html), graphics files (.gif, .jpg or .png), Adobe Acrobat files (.pdf), Macromedia Flash files (.swf), Microsoft Word files (.doc) ASP files (.asp), etc.
Hits
The total number of requests that were made to the site during the reporting period.
Any request made to the web server is logged as a hit. The request can be for files, such as an HTML page, graphic image, audio file or CGI script, or queries made by search engine spiders.
Kbytes
The amount of data in kilobytes (KB) sent out by the server during the reporting period.
Though not exact, this figure is a relatively accurate representation of the amount of outgoing traffic the server had.
Pages
The number of pages viewed during the reporting period. This is also called Page Views.
Hypertext mark-up files (.html or .htm) and files that generate HTML documents (for example, .asp .cgi). are considered pages, with the definition of a page varying by server. By default, our servers define as a page any file with one of the following extensions:
- .htm*
- .cgi
- .chtml
- .shtml
- .phtml
- .php*
- .pl
- .py
Some people consider the pages total to be the number of pure hits. In other words, it is a more accurate indication of the traffic your site receives.
Referrers
The record of the URLs from which a request was made during the reporting period.
Example: A user follows a link on www.websiteA.com to your site. The URL of the linking page (www.websiteA.com) is the referring URL or referrer.

Search strings
The record of all unique search strings obtained from the end of the referrer URLs during the reporting period. Search strings are the words entered by users into a search engine or directory to locate information.
Sites
The record of all unique IP addresses that made requests to the Website during the reporting period. The Internet is a network of computers that can share files via a standard protocol. Each computer on the web has a unique IP (Internet Protocol) address, which identifies that computer and differentiates it from other computers. Each request made to the server comes from a unique IP address or site.

Example: Private NetworksWebHosting connecting to the Internet via a router use a single IP address (the router IP address) for security purposes, so one site can represent multiple users.
URLs
The number of unique URLs at your site accessed during the reporting period. The Uniform Resource Locator (URL) or web address identifies a file's location on the Internet, such as a web page or an image on the page. The information is sent to the web server whenever a user follows a link on a web page or types a URL directly into the web browser's address bar.

User Agents
The record of the unique programs and devices used to access your site.

User agents include:
- Web browsers, such as Internet Explorer and Mozilla Firefox
- Search engine spiders, such as those from Yahoo! and Google
- Download managers
- Text-to-speech and similar readers
Usernames
The record of usernames that accessed your site during the reporting period. Log files record access by authorized users (any user with access to password-protected Web resources, such as site members or administrators).

Visits
This is also called Sessions. This is an attempt to measure the number of times visitors go to a website during the reporting period.
As page requests are made to the web server from sites, the server records the IP address and the time which elapses between requests from that IP address. If the time between requests exceeds 30 minutes, web servers log a new visit for that site.
Example: Someone visits a page at your site at 1:00 p.m. and then requests another page at 3:00 p.m. The server records two visits.

Response codes
Response codes (also called status codes) are the coded results of a server's attempt to understand and satisfy a request. Web server responses indicate whether a web object (web page, graphics file, CGI script, etc.) was successfully retrieved or executed and, if not, the reason for the unsuccessful result. Unsuccessful results are also referred to as server error codes.

The following codes are some of the most common responses:
- Code 200 - OK: The request was fulfilled. The Web page was successfully downloaded without error.
- Code 401 - Unauthorized: The code indicates that users have tried to access pages that are restricted to a private network or IP address.
- Code 404 - Not Found: The server has not found anything matching the URL is given, which can indicate broken links in the Website due to the removal of a Web page or other resource. Alternatively, the response may show spelling errors in the URL.
- Code 403- Forbidden: The request is for something forbidden. The code indicates that users have tried to access pages that require user authorization, such as password-protected administration areas or member areas.
- Code 500 - Internal Error: The request failed. The server encountered an unexpected condition that prevented it from fulfilling the request. This code often indicates a script error.
The W3C provides a detailed list of response codes.
How to access your graphs and reports
To view graphs, charts, and reports based on your website traffic and visitor statistics:
- Log in to your control panel.
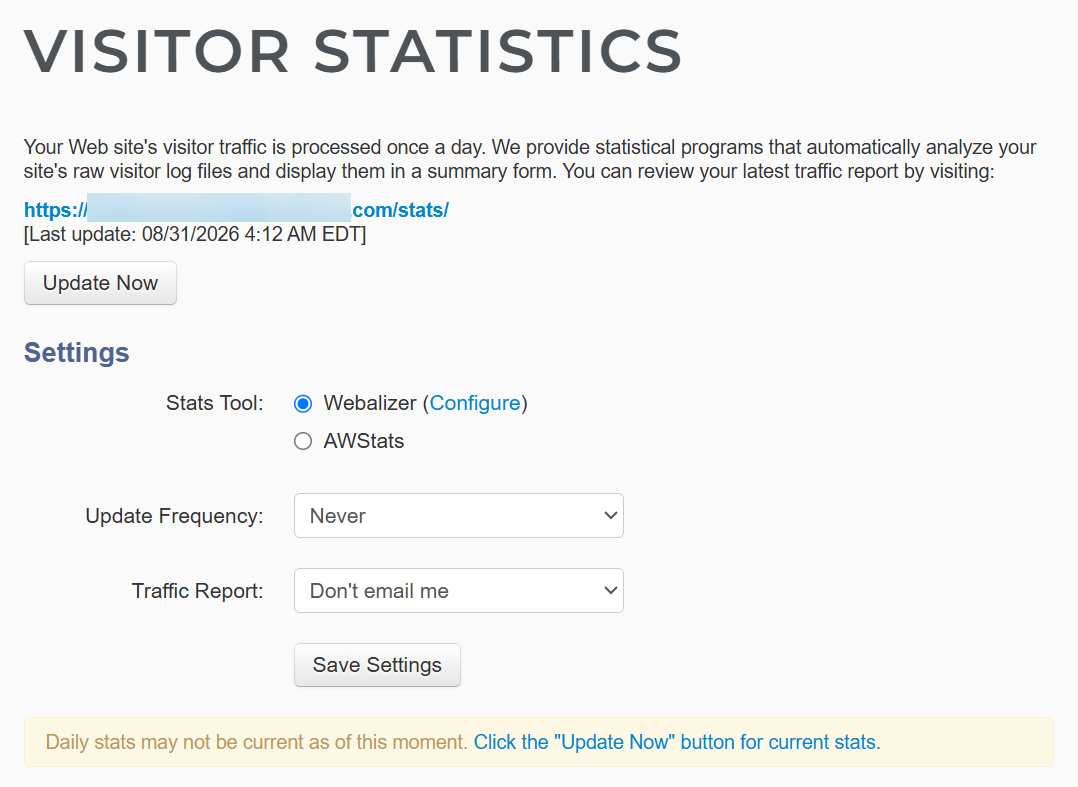
- Navigate to your Hosting tools and click the Visitor Statistics.
- Depending on your hosting plan, you may have access to one or more visitor analytics tools.
- UNIX hosting: You will have AWStats and Webalizer tools option.
- Windows hosting: Visitor statistics are organized on a per-domain basis. Select the domain you want to view, then click Go to access its reports in Webalizer.
Important: If you have forgotten your password, use the password reset option on this page. Resetting the password here will not change your control panel password.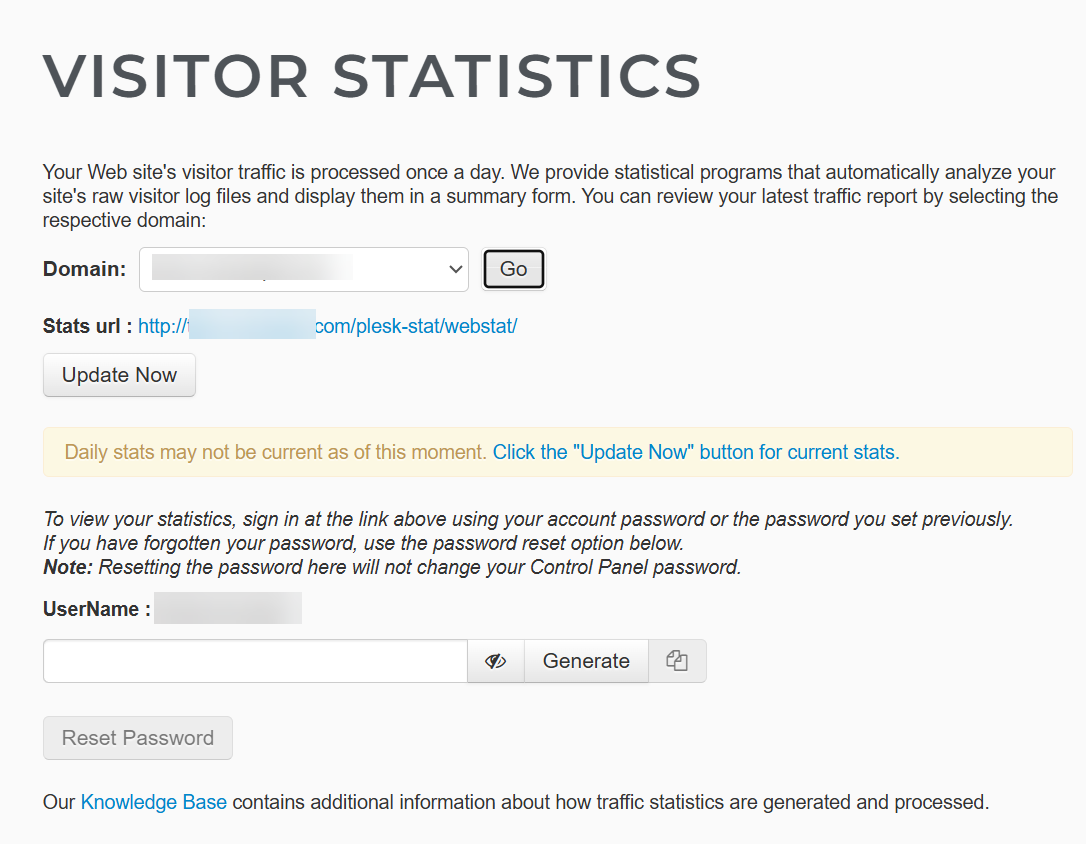
- UNIX hosting: You will have AWStats and Webalizer tools option.
- Use the provided stats URL to access your Visitor Statistics account and review the latest traffic report. Sign in with your account password.
How to change the Webalizer settings
The Webalizer tables and graphs report visitor activity (usage) statistics at your site. You can customize the number of top entries included in these reports or disable reports entirely.
To change your Webalizer settings:
- Log in to your control panel.
- Navigate to your Hosting tools and click the Visitor Statistics.
- In the Visitor Statistics page, click Configure to the right of the Webalizer option. The Webalizer Configuration page displays your current settings.
- For each Number of Top settings, enter either 0 (zero) to disable the report or a positive number to indicate the maximum number of top entries to include in the report.
- For each Display setting, select Yes or No.
- Click Save Configuration to save your new values.
How to manage Visitor Statistics email reports
The weekly and monthly visitor statistics email reports summarize the traffic to your website. This report is sent to your administrative email address. To enable or disable these emails, follow these steps:
- Log in to your control panel.
- Navigate to your Hosting tools and click the Visitor Statistics.
- Under Settings on the Visitor Statistics page, specify the update frequency for visitor statistics and select your preferred report delivery method and schedule.
- In the Update Frequency section, select Daily or Never.
- In the Traffic Report section, choose Don't email me to stop receiving email reports, or select Email me weekly or Email me monthly to receive reports regularly.
- Click the Save Settings option.
I have updated my Website statistics, but they still appear to be old.
The Usage Statistics page's statistics can appear to be out of date when your Web browser is using cached results.
Follow the steps below to update statistics.
- Clear the browser's cache. In most browsers, you can access the menu to clear your browser cache by pressing Ctrl+Shift+Delete from your keyboard or Ctrl+H. As each browser can vary and change, we suggest you refer to http://www.refreshyourcache.com for proper steps for your specific browser.
- Return to the Usage Statistics page for your site to view your updated statistics reports.
Review
This article explains how to use Visitor Statistics to monitor website traffic and visitor activity. It covers how to access and download raw log files, identify which analytics tools are available on your hosting account, and understand the reports generated by AWStats and Webalizer.
Get practical tips and product updates on LinkedIn.
Follow Network Solutions