Key takeaways:
- Businesses that actively track their KPIs are far more likely to hit their targets.
- Tracking the right performance indicators shows what’s working and what’s not. Without KPIs, you risk making decisions based on presumptions.
- To guarantee valuable business outcomes, focus on tracking only the KPIs that truly align with your goals, as monitoring too many can distract you from what matters most.
Many think key performance indicators (KPIs) are something only big corporations care about. After all, small businesses don’t have teams of analysts crunching numbers all day, right?
The truth is, KPIs are just as important for small businesses. And tracking them can actually make you twice as likely to reach your goals, according to a report.
But what are KPIs exactly, and how do they apply to your business? If you’re running a small business, we’ll help you:
- Understand what KPIs are and why they matter
- Explore the main types of KPIs with examples you can use
- Learn how to track and develop KPIs that fit your goals
By the end, you’ll be able to choose a handful of KPIs that are relevant to your business and start using them to drive growth.
What are KPIs?
Key performance indicators are measurable values that show how effectively a business is achieving its objectives. To put it simply, a KPI tells you whether you’re on track, falling behind, or moving ahead of your goals.
KPIs are specific and quantifiable. They can be used to measure performance at different levels, from the entire company down to individual team members.
Businesses of all sizes use KPIs to:
- Track progress toward broader goals
- Identify what’s working well and what could use a little tweaking
- Make choices based on data-driven insights
- Compare today’s results with past performance or even industry competitors
- Get your whole team rowing in the same direction with shared targets
For example, a coffee shop might track average daily sales as a KPI. If the target is $500 a day but the shop is consistently hitting $450, that number helps the owner see where adjustments are needed.
Why are KPIs important?
For businesses, key performance indicators are especially valuable because they help you:
- Turn broad objectives into measurable targets that are easier to track
- Monitor performance against goals, budgets, or expected results so you stay on course
- Highlight trends and problem areas early, before they grow into bigger challenges
- Support evidence-based decision-making rather than relying on assumptions
- Compare progress over time (internally across teams or externally against competitors)
- Stay accountable to yourself and your team
It’s one thing to understand what KPIs measure and why they’re important. Seeing the difference they make is another. So, here’s a simple comparison to show what it’s like to run a business with KPIs, and what happens when you don’t:
| Without KPIs | With KPIs |
|---|---|
| Goals are vague, like “grow sales,” which leaves teams unsure of what to prioritize | Goals are measurable, like “increase sales by 10% this quarter” |
| Decisions are based on opinions and gut feelings | Decisions are based on data and trends |
| Hard to tell if the business is improving or falling behind | Easy to track progress and success |
| Problems may go unnoticed until they become costly or urgent | Issues show up early, so you can plan and act proactively |
| Teams (or you, as the owner) may lack focus | Employees are accountable and focused on common objectives |
| No clear way to judge if results are competitive or improving | Performance can be compared internally (year-over-year) and externally (industry standards) |
What are the differences between KPIs and metrics?
The terms KPI and metric are often used interchangeably, but they’re actually not the same thing. Both involve measurement, yet KPIs carry more weight because they connect directly to strategic business goals.
- Metrics measure day-to-day activities or outputs. They provide useful information but don’t always reflect business success on their own.
- KPIs represent the most important metrics for tracking progress toward your top priorities.
Let’s put it this way: every KPI is a metric, but not every metric qualifies as a KPI. Here are some of their differences at a glance:
| Aspect | KPIs | Metrics |
|---|---|---|
| Definition | A subset of metrics tied directly to business goals | Any quantifiable data point used to measure performance |
| Purpose | Show progress toward strategic outcomes | Track and monitor everyday business activities |
| Impact | High; they drive decisions and strategy | Supportive; provide context and detail |
| Examples | Customer retention rate Sales growth Conversion rate New customers per month | Website traffic Email open rates Store visits White paper downloads |
| Alignment | Always linked to company objectives | May or may not align with strategic objectives |
Common Types of KPIs
Key performance indicators come in many categories, depending on what you want to measure. Some track big-picture goals, while others monitor day-to-day activities. Here are the most common types of KPIs you’ll see in business:
- Strategic KPIs
- Financial KPIs
- Marketing KPIs
- Operational KPIs
- Customer KPIs
- Functional KPIs
- Leading and lagging indicators
- Qualitative KPIs
- Quantitative KPIs
- Input indicators
- Output indicators
Each type has a different purpose, and many businesses even use a combination of some. Below, we’ll explain each type and provide examples so you can see which apply to your small business.
Strategic KPIs
Strategic KPIs are high-level performance measures that track progress toward long-term business goals. They give business owners a view of whether the company is moving in the right direction over months or years.
These key performance indicators are usually:
- Aligned with the overall mission and vision
- Measured over a long timeframe (quarterly, yearly)
- Focused on outcomes rather than daily activities
- Used to evaluate company-wide success, not just departmental performance
Common examples include revenue growth rate, market share percentage, net profit margin, and return on investment (ROI).
While strategic KPIs are often used by executives, even a one-person business or a small team can use them to track annual or quarterly goals, stay on top of long-term projects, and measure progress against their own past company performance.
Financial KPIs
Financial KPIs focus on measuring a business’s financial health and performance. For owners and managers, these financial metrics reveal if the company is earning profits, generating sufficient cash flow, and using resources wisely.
Some key aspects of financial KPIs include:
- Tracking income, expenses, and overall profitability to understand how much money your business is making
- Monitoring cash flow and liquidity, so your business can operate smoothly day to day
- Evaluating customer lifetime value (CLV) to see the total revenue potential from each customer over time
- Helping evaluate investments and budgeting decisions to plan for growth and avoid overspending
Because they highlight key financial trends, these key performance indicators help small business owners make informed decisions about pricing, spending, and growth. However, the frequency of review—monthly, quarterly, or annually—depends on the business’s scale and cash flow cycle.
Operational KPIs
Operational KPIs usually measure the performance of specific processes, workflows, or outputs that support the daily operations of a business.
Let’s say there’s a pattern of delayed deliveries from a business’s warehouse. Customer complaints about late shipments are starting to flood in, which is a real threat to customer satisfaction. The best thing to do is establish an operational KPI to track, say, order fulfillment time, to identify the cause for these delays.
Operational KPIs like order fulfillment time might seem inconsequential at first, but they can provide valuable insights later.
Functional KPIs
Some key performance indicators look at overall performance. Others, like functional KPIs, focus on specific areas of your business to gauge how each contributes to bigger business goals.
For instance, in marketing, track how many leads or inquiries you’re getting. When it comes to sales, KPIs can include conversion rate and total sales closed. In customer service, success is tracked through customer satisfaction scores and average response time.
Functional KPIs, in essence, highlight strengths and weaknesses at the team level. This is especially valuable for small business owners, as these KPIs provide a sharper lens for decision-making.
Leading and lagging indicators
More often than not, business owners review results like revenue growth, customer churn, or profit margins to measure success. Those indicators are examples of lagging KPIs, which simply measure outcomes after past activities.
That information is valuable, of course. But it’s not enough if you want to stay ahead. The problem is, by the time they signal that something’s wrong, the damage might already be done and fixing it could be much harder.
That’s why lagging indicators are often paired with leading KPIs, which, on the other hand, suggest what might happen next. Examples of leading indicators include website traffic, sales inquiries, or repeat visitor numbers. These metrics give you a window into your business’s likely future performance.
Neither type works well on its own. A spike in web traffic (leading), for instance, matters most when it translates into higher revenue (lagging). Employee engagement scores (leading) only show their full impact when connected to lower turnover rates (lagging).
When you pair the two, you get both the forecast and the confirmation. For small business owners, using both types of KPIs creates a more reliable perspective of performance and future growth.
Qualitative KPIs
You probably know this already, but not every measure of success can be captured in a spreadsheet. Numbers alone don’t always reveal why customers stay loyal or why employees feel motivated. That’s why looking at qualitative KPIs is also important.
Qualitative KPIs focus on subjective insights, like the experiences, opinions, and perceptions that shape your business outcomes. For example, a customer survey might reveal that buyers love your product but dislike your checkout process. That feedback pinpoints areas to improve that wouldn’t show up in sales numbers alone.
Some common qualitative KPIs include:
- Customer feedback and satisfaction surveys
- Employee engagement or morale surveys
- Brand perception or reputation scores
If you pay attention to these KPIs, you’ll understand your business better than by looking at numbers alone. They help you identify hidden problems before they affect results and, more importantly, improve customer experience and employee satisfaction.
Quantitative KPIs
In any small business, numbers reveal opportunities and risks. And quantitative KPIs turn those raw numbers into insights, so business owners will have an objective view of their business performance.
Quantitative KPIs are numerical metrics that track specific outcomes or processes. They provide measurable data that can be analyzed over time to guide decisions, monitor progress toward goals, and evaluate the impact of business activities.
Some common quantitative KPIs include total revenue, customer acquisition cost, sales growth rate, churn rate, and website conversion rate. Each one gives you a measurable view of how your business is performing in different areas.
For small business owners, quantitative key performance indicators do four main things:
- Highlight trends
- Track what’s working
- Guide resource allocation
- Help set measurable goals for your team
Input indicators
Every business activity requires resources, such as time, money, materials, and labor. All of these are input indicators, or simply metrics that measure the resources invested in a business process or activity.
Business owners gain a lot from monitoring input indicators. They can use these key performance indicators to see how resources are used effectively and point out where changes are needed.
For instance, a small bakery launching a new pastry line might track total labor hours and ingredient costs for each batch. If sales don’t meet expectations, input indicators reveal whether inefficiencies in resource allocation are part of the problem.
Common input KPIs include:
- Total labor hours
- Production costs
- Raw material usage
- Marketing spend per campaign
- Training hours
Output indicators
Naturally, every process in your business is meant to deliver results, from sales to completed projects to resolved customer issues. But how do you know if the effort you’re putting into your business is actually paying off? Through output indicators.
Output indicators are metrics that track what has actually been accomplished through your efforts. Say, your marketing team runs a social media campaign. You might measure output indicators like number of leads generated, newsletter sign-ups, and clicks on a call-to-action link.
Now, what would this mean for your small business?
For one thing, you’ll determine which efforts produce results and which need a bit of adjustment. You’ll also be able to make informed decisions about how to allocate time, money, and resources properly.
KPI examples for small businesses
The following are some KPI examples that small and medium-sized businesses can track. We’ve provided good and bad examples so you can see what works and what doesn’t measure success.
Marketing KPIs (SEO-focused)
Is your website traffic actually driving business growth? To find out, it’s best to start tracking marketing KPIs.
SEO indicators, for instance, are just one of the many marketing metrics to keep an eye on. They show how your marketing objectives are translating into results and should guide your planning.
A good SEO KPI is specific and measurable. For example, “Increase organic search traffic by 30% over the next quarter.” This gives your team a concrete target, as opposed to a vague KPI like: “Improve website SEO.”
Without details on how clear targets, timeframes, and specific success metrics are, it’s hard to tell whether your marketing campaign is effective or not.
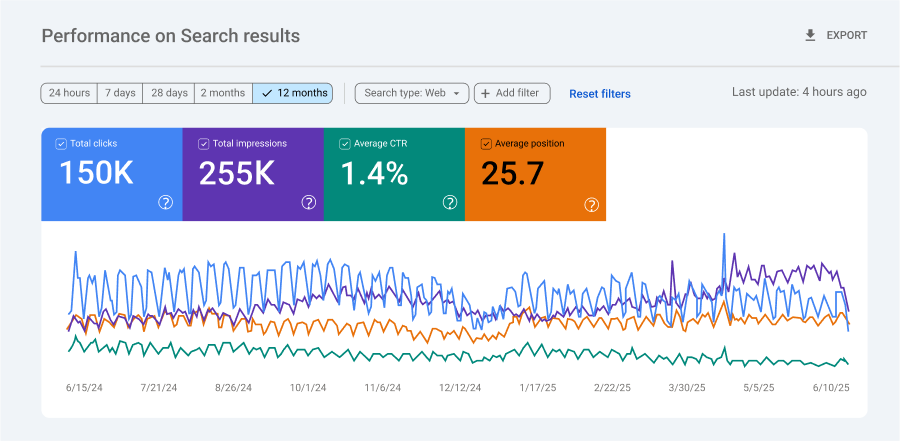
Tools like Google Analytics or Search Console let you track SEO KPIs and website performance metrics.
Here’s what a Google Search Console dashboard looks like. Notice the KPIs it highlights: clicks, impressions, CTR, and average position. These are the numbers you can use to measure progress and adjust your marketing strategy.
Sales KPIs (Conversion-focused)
According to a study, sales reps who review their sales KPIs weekly are much more likely to meet their monthly goals. Among the most important sales metrics is conversion rate, which basically measures the number of leads that become paying customers.
Tracking conversion rate helps you see whether your efforts are actually turning prospects into customers, rather than just generating activity without results.
Like any performance indicator, your sales KPI should be specific, measurable, and time-bound. So, instead of tracking a weak KPI like “Improve sales performance,” use a clear target such as: “Increase the monthly lead-to-customer conversion rate from 12% to 18% within the next quarter.”
To monitor conversion rates, you can use CRM tools like HubSpot or Salesforce. By and large, keeping an eye on this particular KPI lets you quickly identify where leads are getting stuck in your sales process.
Customer success KPIs
Who ultimately determines if your business is thriving? Your customers, of course.
That’s why tracking customer service KPIs and customer satisfaction indicators is necessary. They show how well you’re meeting customer needs, keeping them satisfied, and turning them into loyal advocates.
One key KPI to focus on is customer satisfaction (CSAT). A good KPI example would be a well-defined KPI could be: “Achieve a CSAT of at least 90% in post-support surveys this quarter.” It’s specific, measurable, and has a set timeframe. On the other hand, a vague KPI like “Make customers happy” doesn’t give you anything to track or act on.
Small business owners can measure CSAT by sending short post-interaction surveys via email, SMS, or in-app prompts. Tools like SurveyMonkey, HubSpot, Zendesk, or Typeform make collecting data easy, so you can track trends and improve customer experience over time.
How to develop KPIs for your small business
Here’s an easy, step-by-step way to build KPIs that match your business goals:
- Start with your key business objectives
- Choose relevant KPIs that will really help you measure progress
- Set realistic KPI targets
- Decide how and when to measure
- Communicate KPIs across your team
- Review, learn, and adjust
Let’s break down the process in detail:
1. Start with your key business objectives
Before you even think about indicators or metrics, ask yourself: What am I trying to achieve?
Think about your biggest priorities. Is your goal to improve customer retention rate, grow revenue, increase your website’s conversion rate, or streamline resource utilization? If so, your KPIs should flow directly from these objectives.
For example, if your goal is to increase revenue, a good KPI could be: “Increase monthly sales revenue by 15% over the next quarter.”
See the difference? This KPI is specific, measurable, and tied to a timeframe. It gives you a clear target to aim for, unlike vague indicators like “Grow sales.”
2. Choose relevant KPIs that will really help you measure progress
Keep in mind that not every metric is worth tracking. The right key performance indicators should provide valuable insights and tell you exactly where to put your efforts for the best return.
For marketing, that might be conversion rate or cost per lead. For customer service, it could be CSAT, Net Promoter Score (NPS), or average response time.
Will this KPI help you make informed decisions? Will it show whether your efforts are making an impact? If the answer is no, it’s just a vanity metric that you should ignore.
3. Set realistic KPI targets
KPIs should help your business grow, but they also need to be achievable. Consider your past performance, what’s typical in your industry, and the resources you actually have.
Say your conversion rate was 10% last quarter. Doubling it to 20% might sound nice, but it’s probably not realistic. Aiming for 12–15% is a tougher but still achievable stretch. The best targets inspire you (and your small team) without overwhelming them.
4. Decide how and when to measure
Consistency, as always, is key. Some metrics, like sales pipeline conversion, benefit from frequent checks. Others, like brand awareness, might need monthly or quarterly tracking.
Tools like Google Analytics, HubSpot, or even a simple spreadsheet can help you keep your KPIs visible. The goal is to create a rhythm where reviewing KPIs becomes a natural part of decision-making and not merely an afterthought.
5. Communicate KPIs across your team
KPIs only work if everyone on your team understands them and knows how their work contributes to those goals. So, share the targets and explain why they matter.
Integrate KPIs into daily workflows. For example, a weekly sales dashboard can show how many leads each team member generated, the conversion rates, and total revenue. During team meetings, review these numbers together and discuss what’s working, what’s slowing results, and which strategies to try next.
6. Review, learn, and adjust
As your business grows and evolves, so should your metrics. Regularly review them and make sure they are still aligned with your goals. Adjust targets, add new KPIs, or remove old ones as needed.
How to track and measure KPIs
Here’s how small business owners can track and measure their chosen KPIs:
- Make your KPIs SMART
- Choose the right tracking tools
- Set up dashboards for real-time tracking
- Assign ownership for each KPI
- Review your KPIs regularly
Make your KPIs SMART
Before you start tracking, make sure each of your KPI is SMART:
- Specific, with a clear and focused objective like “Increase monthly website leads by 20%” rather than “Get more leads”
- Measurable, with a quantifiable target
- Achievable, ambitious, but realistic given your resources
- Relevant, or directly tied to your specific business objectives.
- Time-bound, with a defined timeframe, like “by the end of this quarter”
Choose the right tracking tools
When selecting tools to monitor your KPIs, the goal is to find a solution that fits your specific needs without overwhelming you. The right tool will make data analysis easier, not more complicated.
For comprehensive web data, use Google Analytics or similar analytics software
If you want to understand how people are finding and using your website, Google Analytics is the industry standard. It provides a wealth of data on website traffic, user behavior, and conversion rates.
For sales and customer data, try HubSpot
When your focus is on sales performance and customer relationships, a CRM (Customer Relationship Management) tool is the better choice. HubSpot is a great option because it helps you track sales pipelines, manage customer interactions, and monitor sales strategies across your funnel.
For at-a-glance KPI dashboards, consider SimpleKPI or Geckoboard
If you’re already tracking data in multiple places and need a single, visual summary, dashboard tools like SimpleKPI or Geckoboard can be a game-changer. These platforms pull reliable data from various sources to create custom reports and easy-to-read dashboards that give you a high-level view of your performance at a glance.
For small-scale tracking, start with a spreadsheet
Don’t feel pressured to invest in expensive software right away. For startups and smaller businesses, a well-organized spreadsheet can be all you need. It’s a flexible and cost-effective way to manually track a few key metrics and get comfortable with data analysis before you scale up.
Set up dashboards for real-time tracking
The power of dashboards is already proven. According to a survey, roughly 60% of companies that achieve at least 75% of their goals use live dashboards to share their progress.
These visualization tools are the control panel for your company’s performance. It gives you a visual, at-a-glance overview of your most important KPI data. There’s no need to dig through raw data. You can quickly identify trends, see how you’re performing right now, and easily recognize issues and opportunities as they happen.
Assign ownership for each KPI
Each KPI should have someone responsible for monitoring it. For instance, the sales team can be responsible for tracking conversion rates and sales pipelines. Meanwhile, the customer service department handles customer service KPIs like customer retention rate.
Review your KPIs regularly
Finally, set a review schedule—weekly, monthly, or quarterly—depending on the KPI. Look at trends, compare against targets, and adjust strategies when needed. For example, if a KPI like lead-to-customer conversion is falling, investigate the problem area and act quickly.
What are the most common KPI mistakes small businesses make?
Even the best KPIs won’t help your business if they’re not set up or managed correctly. For successful results, avoid:
- Tracking too many KPIs, which can overwhelm your team and overshadow strategic priorities
- Choosing irrelevant metrics; they only waste time and don’t contribute to your goals
- Not revisiting KPIs regularly, because this leaves your strategy based on outdated or inaccurate data
- Setting unrealistic targets, which can demotivate your team or push them to take shortcuts
- Failing to communicate KPIs, meaning your team might not understand how their work affects results
- Ignoring important context, such as past performance and industry standards
- Focusing only on lagging indicators, which keeps you from identifying opportunities or risks early
- Relying solely on quantitative data; customer feedback and qualitative information are just as important
- Not linking KPIs to action, which turns metrics into numbers that don’t really promote change
- Changing KPIs too frequently; this creates confusion and reduces accountability among your team
- Tying KPIs to incentives, as this only encourages employees to focus on hitting the numbers rather than improving actual performance
- Neglecting resources required for tracking, which can make KPIs difficult to maintain effectively
Start tracking KPIs and grow your business
When chosen and tracked thoughtfully, KPIs show you what’s working and reveal opportunities for your business.
Start small. Pick a handful of relevant KPIs, set clear targets, and review them regularly. As your small business grows, you can expand your metrics and improve your tracking system.
Want to take control of your business performance online? Our team of experts can help you figure out the right KPIs, keep track of progress, and make decisions that help your business grow. For small business owners juggling multiple roles, we make tracking and improving online performance simple and practical.
Frequently asked questions
A Key Performance Indicator (KPI) is a measurable value that shows how well your business is achieving a specific goal. For example, a marketing team might set a KPI to increase qualified leads by 10% in the next quarter, or an eCommerce business might aim to improve its customer retention rate by 5% over the next year. KPIs help you track your organization’s progress, see what’s working, and make smarter business decisions.
The 4 Ps—Product, Price, Place, and Promotion—are core marketing concepts that can help guide your KPIs. While there isn’t an official “4 Ps of KPI” framework, the idea is to use these four areas as a lens for creating meaningful KPIs. For example, you might track the success of a promotion with a KPI like “Increase sales of Product X by 15% in the next quarter.”
A strong KPI is SMART: Specific, Measurable, Achievable, Relevant, and Time-bound. It should give you insights you can act on immediately and align closely with your broader business goals. But beware of tracking too many at once; when everything is a KPI, nothing is. It’s better to focus on the few that produce tangible business outcomes.
KPIs vary by industry, but some common examples include:
Finance: Net profit margin
Retail & Telecom: Customer satisfaction score
Manufacturing: On-time delivery
HR: Employee turnover rate
IT: Server downtime
Other KPIs that cross industries include Revenue Growth, Cost Reduction, Lead Conversion Rate, and Customer Acquisition Cost. Choosing the right KPIs depends on your business goals and what matters most to your team.